CRJ102 / Contemporary Corrections
Chapter 8
U.S. Prison System: Growth, Classification, Organization, and Privatization
This chapter examines how American prisons grew, how state and federal systems are organized, how classification shapes institutional life, and how privatization and correctional spending complicate the modern prison system.
Chapter Overview
Prisons are often described by security level or jurisdiction, but those labels reveal only part of the system. Modern prisons are organizations with chains of command, specialized staff, classification systems, budgets, programs, medical responsibilities, physical plants, and relationships with courts, probation agencies, contractors, and communities. This chapter moves from the historical growth of imprisonment to the organizational and financial realities of contemporary state and federal corrections.
The Growth of Prisons in the United States
As mentioned at the beginning of this section on jails and prisons, the Walnut Street Jail is recognized as the first built institution in the United States to house individuals. Soon after, another prison was built, the Eastern State Penitentiary (ESP), and it ran like a prison for nearly 150 years. Many of the prisons today were first built on this idea of a separate penitent prison. Many of the cells in the prison (as depicted below) would open to individual courtyards where individuals could look up and “get right with God,” hence the concept of penitentiary (penance).
The State Penitentiary for the Eastern District of Pennsylvania, Lithograph by P.S: Duval and Co., 1855.
Individuals in ESP spent much of their time in their cells, or their own reflection yards, reading the bible, praying, and always in silence. The solitude was also a way to serve penance. Shortly after the implementation of ESP, another prison was built in New York, in 1819, named the Auburn prison. This prison would become the leader of the second main prison style, the Auburn prison system. Many of the facets of the ESP were in the Auburn, save one. Auburn utilized a congregate system, which meant that (still in silence) the inmates would gather to do tasks or work.
This concept of labor eventually replaced the ideals of constant solitude. The congregate system took hold as the dominant model for many prisons, and many states began to model their prisons on the Auburn prison. Notably, Auburn was also the prison where the first death by electric chair was executed in 1890. Today, there are roughly 1,700 State or municipal prisons in the United States. As the images demonstrate, it is clear that many of the prisons in the U.S. are built more recently.

Types of Prisons and Correctional Jurisdictions
Prisons in the United States can be parcelled out by jurisdiction and by intensity. By jurisdiction, this refers to who manages the prisons. A prison warden is generally considered the managerial face of the institution. However, a prison warden and the prison itself are usually within a much larger organizational structure. Although not always, these are usually separated by State. There are a few jurisdictions not at the State level that manage or operate prisons. This includes places like New York, Chicago, Philadelphia, and Washington D.C. Puerto Rico (not a State) also has a prison, as does the U.S. territory of the Virgin Islands.
The normal label for the organizational structure of prisons in a particular State is often called Departments of Corrections and are run by a Director, who is usually appointed by a Governor. For example, in Oregon, it is the Oregon Department of Corrections, and Director Peters is the current head of this organization (2012-present). The Oregon Department of Corrections currently oversees 14 State prisons. More information about the ODOC. California has the California Department of Corrections, and Secretary Diaz is the head of this organization (2018 to present). CDCR oversees 34 adult institutions. More information about CDCR.
The Federal Bureau of Prisons was established in the early 1930s as a result of the need to house an increasing number of individuals convicted of federal crimes. There were already some federal prisons in place, but it was not until 1930 that the U.S. Congress passed legislation to create the BOP, housing it under the Justice Department. Sanford Bates became the first Director of the Federal Bureau of Prisons (FBOP or BOP), based on his long-standing work as an organizer and leader at Elmira Reformatory in New York. As more federal legislation was passed, the need for more prisons became apparent.
Today, the BOP has 109 prisons, along with numerous additional facilities (camps) adjoining these locations. There are also military prisons, alternative facilities, reentry centers, and training centers, that are managed by the BOP. The federal prisons are separated into six regions., which include: the Mid-Atlantic Region, the North Central Region, the Northeast Region, the Southeast Region, the South Central Region, and the Western Region.
Within these regions are regional directors, which is similar to state-level directors of departments of corrections. Below is a detailed map of the regions of the Federal Bureau of Prisons. As is depicted, there are several different types of facilities within each region. A central office is also designated for each of the six regions. Click on the link in the annotation of the map to see it on a larger scale.
The privatization of goods and services has long been a staple of state departments of corrections, as it allows these organizations to subcontract specific tasks within their prisons. This includes services like food and transportation services, medical, dental, and mental health services, education services, and even laundry services. As mentioned in the previous section on punishment, there was much ado about crime in the United States in the 1970s and 1980s. This brought on an increased fear of crime and a more punitive state within the United States. It was during this time that a small company known as Wackenhut, a subsidiary of The Wackenhut Corporation (TWC) sought to privatize the entirety of a prison, not just services within the prison. A second company, Corrections Corporation of America ultimately won the contract and became the first privately owned prison in the United States (1984). Today, Core Civic (formerly Corrections Corporation of America) runs approximately 128 facilities in the United States. [1] The GEO Group, the other primary private prison company runs 136 correctional, detention, or reentry facilities. [2] Pictured below, roughly half of the 50 States in America use private prison industry prisons.
Private Prison State Map
Much debate has come from the incorporation of private prisons. The critics of private prisons denote the lack of transparency in the reporting processes that would come from a normal prison. Still, others tackle a bigger issue – punishment for profit. That is – while taxpayers ultimately pay for all punishment of individuals, either at the State or Federal level, shareholders and administrators of the companies are making money by punishing people, under the guise of capitalism.
Prison Classification and Security Levels
Each of these jurisdictions of prisons also has varying degrees of intensity or seriousness. These are often considered prison levels or classifications. Depending on the State, the BOP, or even the private sector, it is usually associated with the seriousness of the offenders that are housed within these institutions. For example, many States have three classification levels: minimum, medium, and maximum. Some States have a fourth level called super-maximum. Others call this close, or administrative level. The BOP has five levels, minimum, low, medium, high, and unclassified. Although not a true designation, and would be considered an unclassified, administrative control, ADX Florence is a United States Penitentiary (USP) that would be counted as a super-max. It houses the most dangerous individuals at the Federal level. Although not in operation today, Alcatraz was probably the most famous Federal USP (also considered a super-max at one point). It too housed the most dangerous federal inmates. Below are two images of this iconic prison, known as the “rock.”
Other States use a simple number designator to assign prison intensity, such as Level I, Level II, Level III, Level IV, and sometimes Level V. While still, other States incorporate a Camp to their list of designations, indicating a specific purpose within the low level, such as a Fire Camp. These types of camps are dedicated to fighting fires. In all, there are some basic concepts to point out for each type:
Minimum – These prisons usually have dorm-style housing, typically for only non-violent offenders, with shorter sentences (or sentence lengths left after downgrading). The fencing or perimeters of these types of facilities are usually low levels. The BOP generally refers to these as camps.
Low – These types of prisons are similar to minimums, to include some kind of dormitory-style housing. However, there are normally more serious or disruptive offenders in these types of prisons. The fencing around the perimeter of these is generally higher, and maybe even a double fence. Offenders are typically in these institutions for longer periods.
Medium – Here, there is a transition from dorm-style housing to cells. Normally, there are two persons in a cell, but not always. The perimeter is usually a high fence, and may even have barbed wire, or there are large walls surrounding the institution. Freedom of movement within the institution is reduced and seen as a privilege. Inmates here typically have longer sentences and include violent convictions.
High or Maximum – Similar to medium, but most of these offenders have violent convictions, and longer sentences, including life. Many of these individuals will spend most of their day in a cell, and more often than not, these are single occupancy.
Super-Max or Administrative Control – Depending on what the mission is for that particular prison, the prisoners in these institutions could be vastly different. For instance, if it is a facility that is designated for mental health, it would not operate the same as one that is a supermax. The super-max facilities would have individuals in their cells for almost all of every day. Many services would come to them at their cell, and instead of them going somewhere (i.e., sick call), the cells would almost all be single occupancy. Visitation of these inmates would be much more regimented and monitored. Most of these individuals are also classified as extreme threats to the successful operations of the prison and are long-term inmates (LWOP – life without the possibility of Parole).
Intake Centers – An intake center can be part of an institution, running alongside the normal operations of an institution. The purpose of an intake center is to classify the offenders coming from the various courts in the jurisdiction, post felony conviction. The offender has an initial classification, where they are getting assigned to one of the jurisdiction’s prisons, based on a point system for that agency. This assessment looks at priors, prior and current violence, escape risk, and potential self-harm. For example, Coffee Creek Correctional Facility in Oregon is their intake of prison. It also is the women’s prison for Oregon. Inmates come to CCCF and are assessed, then shipped off to one of the other institutions in Oregon (or placed in a level there if female). Inmates will gain later classifications at their destination prison, in terms of work assignments, mental health status, cell assignments, and other items.

Who Goes to Prison?
The types of people that end up in prison are quite different than individuals that go to jail. Almost all people who go to prisons in the United States are people who have been convicted of felony-level crimes and will be serving more than a year (or they could have multiple years on their jail sentence). To give you a more detailed depiction of this, see the image below.
Focusing on the left side of the graphic, there are roughly 1,316,000 State Prisoners. Here we can see the types of crimes that they are convicted of. A little over half (54-55%) are incarcerated for violent crimes. Drug crimes and property crimes make up the next big sections for state prisoners. When you add in the federal prisoners (about 180,000) and the private sector prisoners (another 150,000+), territorial prisoners (11,000), and Indian Country prisoners (2,500), we start to see how that number changes to about 1,700,000 prisoners.
One of the more notable items here, and what is different from the jails, roughly 93% of the prisoners are male. In jail, that number is roughly 85% male. While the total volume of prisoners has dropped slightly in the last few years (since 2015), the following graphic shows that we have increased our number substantially over the last 45 years.
US State and Federal Prison Population
This growth of the prison population will be discussed in greater detail in the final section on corrections and special Issues. However, in the next section, we will discuss where the largest volume of individuals under correctional control resides, probation and community corrections.

How State Prison Systems Are Organized
A state prison is both a secure institution and a complex public organization. Its most visible function is custody: keeping people who have been sentenced to imprisonment safely confined. Yet confinement alone does not explain how a modern prison operates. A prison must maintain order, protect staff and incarcerated people, classify and house individuals, provide food and basic necessities, maintain buildings and security systems, transport people, keep legal and institutional records, provide access to health care, education and programming, respond to emergencies, and prepare people for eventual release. These responsibilities require a formal organizational structure that identifies who has authority, who is accountable for particular functions, and how decisions move through the institution.
State correctional systems therefore resemble other large public agencies in one important respect: authority is distributed across multiple levels. A governor and state government establish the broad legal and budgetary environment. A department of corrections, usually led by a secretary, commissioner, or director, administers the statewide system. Central-office or regional administrators oversee groups of institutions and statewide functions. Each prison is then led by a warden or superintendent, with subordinate administrators responsible for major operational areas. The titles differ among states, but the underlying organizational problem is similar: a statewide agency must create consistent policy while allowing individual institutions to manage different populations, security levels, physical plants, staffing patterns, and local conditions.
Organizational charts can make prison administration look like a simple chain of boxes. In practice, the structure serves several purposes. First, it establishes authority. Staff need to know who may issue orders, approve movement, authorize searches, make classification decisions, impose or review restrictions, approve expenditures, and respond during an emergency. Second, structure creates accountability. When responsibility for an institutional function is clearly assigned, administrators can evaluate whether policy was followed and determine where corrective action is necessary.
Third, structure coordinates specialized functions. Security staff cannot operate independently of classification, records, transportation, programming, maintenance, food service, and other institutional units. A housing decision can affect security, program eligibility, work assignments, transportation, visitation, and release planning. Organizational structure creates formal relationships through which these functions can communicate and make coordinated decisions.
Finally, structure connects individual prisons to statewide policy. A warden has substantial responsibility for a facility, but a state prison is not an independent organization. It operates under statutes, statewide regulations, departmental directives, budget rules, labor agreements, court orders, and professional standards. The organizational hierarchy is the mechanism through which those requirements are translated into institutional practice.
Most state prison systems are administered by a cabinet-level or principal state agency commonly called a Department of Corrections or Department of Corrections and Rehabilitation. The agency head may be called a commissioner, secretary, or director. The title is less important than the function. This official is the chief executive of the correctional department and is responsible for the overall administration and strategic direction of the state system.
Michigan provides a clear example. Its Department of Corrections identifies the director as the department's chief administrative officer. A Correctional Facilities Administration, headed by a deputy director, is responsible for the operation of correctional institutions. Assistant deputy directors oversee institutions, and each institution is administered by a warden. Other statewide units support functions such as classification, records, emergency management, transportation, budgeting, and institutional operations. This illustrates a common state model: central administration establishes policy and allocates resources, intermediate administrators supervise groups of institutions or specialized functions, and wardens manage individual prisons.
States do not all organize prisons in exactly the same way. Smaller systems may rely heavily on a central office, allowing wardens to report through a relatively short administrative chain. Larger systems may insert regional or divisional levels between central administration and individual institutions. Geography, number of facilities, population size, institutional missions, and the scope of the department all influence the structure.
California illustrates how a large system can reorganize around regions. Beginning in 2025, the California Department of Corrections and Rehabilitation shifted its Division of Adult Institutions to a geographic regional structure. Wardens report through regional leadership rather than relying exclusively on a distant central-office model. The stated goals include faster decision-making, closer support for institutions, stronger accountability, and better coordination across institutional operations and rehabilitative services.
Washington demonstrates another variation. Its Department of Corrections separates major statewide responsibilities into divisions, including a Prisons Division. That division oversees the state's prisons while also carrying responsibility for functions such as classification and case management, investigative operations, statewide transportation and extradition, family and volunteer services, and visitation. The example demonstrates that organizational structure is not simply about rank. It also determines where important functions are located within the agency.
At the institutional level, the warden or superintendent is normally the senior administrator. The warden is responsible for the overall operation of the prison, but does not personally manage every activity. Instead, the warden leads an executive or command staff composed of deputy wardens, chief deputy wardens, associate wardens, assistant superintendents, business managers, security administrators, program administrators, and other division heads. Titles vary significantly from state to state.
California's description of the chief deputy warden illustrates the breadth of institutional administration. The position coordinates institutional programs, serves as the operations chief, supervises subordinate administrators, helps develop local policies, interprets departmental requirements, and may act as warden when the warden is absent. Associate wardens may then administer major institutional divisions or operational areas. This layered structure allows the warden to maintain institution-wide responsibility while delegating day-to-day management to administrators with more focused responsibilities.
No single organizational chart accurately represents every state, but the following model captures a common pattern. The exact titles and reporting relationships should be understood as illustrative rather than universal.
Security is usually the largest and most visible institutional function. Correctional officers supervise housing units, control movement, conduct counts and searches, respond to incidents, staff posts, escort incarcerated people, and enforce institutional rules. Sergeants, lieutenants, captains, majors, and comparable ranks provide progressively broader supervision. Depending on the state and institution, security administration may also include perimeter security, armories, emergency response teams, intelligence operations, contraband interdiction, restrictive housing, transportation, and control-center operations.
The chain of command is particularly important in a prison because routine operations can quickly become emergency operations. A medical emergency, assault, disturbance, fire, escape attempt, major contraband discovery, or institutional lockdown requires staff from multiple units to act within a clearly understood command structure. Formal rank provides a mechanism for assigning responsibility and coordinating a response without requiring every decision to reach the warden.
Classification is another core organizational function. State systems must decide where an incarcerated person will be housed, what security level is appropriate, whether separation from particular individuals is necessary, and what work, educational, treatment, or program assignments are suitable. Classification decisions affect both the individual and the institution. Poor placement decisions can increase violence, disrupt programs, create escape or victimization risks, and make scarce beds difficult to manage.
Some states centralize significant parts of classification, while others distribute more authority to institutions. Washington places classification and case management within the responsibilities of its statewide Prisons Division, while Michigan identifies a central Classification Section within its correctional facilities structure. Regardless of placement on an organizational chart, classification links central policy with daily institutional management.
Prisons also contain organizational units responsible for activities that extend beyond custody. Academic education, vocational training, substance-use programming, cognitive and behavioral interventions, religious services, recreation, library services, prison industries, work assignments, and release preparation may be administered through separate departments or combined under a deputy or associate warden. The structure reflects the state's correctional philosophy and the size and mission of the institution.
These units do not exist outside the security structure. Classes require movement schedules. Work assignments require classification and supervision. Volunteers require screening and access procedures. Program participation may affect housing and release planning. Effective prison administration therefore depends on coordination between custody and noncustody functions rather than treating them as competing organizations inside the same facility.
A prison also functions as a large physical and logistical operation. Business and support units manage budgets, purchasing, contracts, warehousing, property, food service, maintenance, utilities, vehicles, information systems, and other resources. Human resources and training units manage hiring, assignments, leave, labor issues, and professional development. Records staff maintain sentence, court, transfer, and release information. Transportation units coordinate movement between institutions, courts, medical appointments, and other destinations.
These functions may receive less public attention than security, but institutional safety depends on them. A malfunctioning locking system, staff vacancy, delayed repair, inaccurate sentence record, food-service disruption, or transportation failure can immediately become a security and management problem. Prison organization therefore integrates administrative and physical-plant functions into the institution's overall system of control.
Not every person working inside a prison fits neatly into the custody chain of command. Educators, clinicians, counselors, chaplains, investigators, information-technology staff, maintenance employees, contractors, and other professionals may report through specialized administrative structures. Some services may be managed centrally at the department level while staff perform their work inside individual institutions.
This creates a form of shared organizational authority. The warden remains responsible for institutional safety and overall operations, while specialized professionals may also answer to licensing standards, departmental program administrators, legal requirements, or professional rules. Effective prison leadership requires these parallel structures to function together. Organizational charts show formal reporting lines, but daily prison administration depends heavily on coordination across them.
The United States does not have one state prison organizational model. Each state has developed its own correctional bureaucracy through statute, administrative history, institutional growth, court intervention, budget decisions, and correctional philosophy. One department may combine prisons and community supervision, while another may place parole or probation elsewhere. One may operate through regional offices; another may rely more heavily on central administration. One may organize institutions primarily by security level, while another may use geography or mission as an important administrative category.
The California, Michigan, and Washington examples illustrate this variation. Michigan uses a Correctional Facilities Administration with intermediate administrators overseeing wardens. Washington places prisons within a distinct statewide division that also manages several cross-institutional functions. California's recent regional model places institutional leadership closer to groups of prisons. The structures are different, but all are attempting to solve the same fundamental problem: how to maintain consistent statewide standards while managing institutions that differ substantially in population, mission, security, staffing, and physical design.
An organizational chart describes formal authority, but it does not capture every relationship that shapes institutional life. Prisons operate twenty-four hours a day, seven days a week. Senior administrators are not physically present for every decision. Shift commanders and front-line supervisors therefore exercise substantial operational responsibility. Experienced correctional officers and specialized staff also possess institutional knowledge that may influence how policy is implemented in practice.
This distinction between formal structure and actual organizational behavior is important. A policy may originate at central office, be interpreted by regional administrators, implemented by a warden, translated into post orders by security managers, supervised by lieutenants and sergeants, and ultimately carried out by correctional officers. Information also travels upward. Incident reports, staffing problems, grievances, audit findings, classification concerns, and operational data move from institutions toward higher levels of administration. A correctional system therefore depends on both downward authority and upward information.
How a state organizes corrections reveals what it considers important. Creating a separate rehabilitation division, regionalizing prison leadership, centralizing classification, expanding investigative operations, or placing reentry at the executive level are not merely changes to an organizational chart. They distribute authority and resources. They determine which administrators participate in major decisions and which functions receive direct access to senior leadership.
For students of corrections, organizational structure therefore provides a way to understand prisons beyond walls, cells, and security levels. A prison is part of a larger statewide bureaucracy, and the effectiveness of the institution depends on how that bureaucracy allocates authority, coordinates specialized functions, communicates policy, supervises staff, and holds decision-makers accountable. Understanding that structure is necessary before examining how individual prisons are classified and operated.
State prisons are complex organizations operating within larger state correctional systems. Although titles and reporting relationships differ, most systems establish a hierarchy that connects statewide executive leadership to institutional wardens and then to managers, supervisors, officers, and specialized staff. Within the prison, custody and security remain central, but they operate alongside classification, programming, records, transportation, business services, maintenance, and other essential functions.
The central challenge is coordination. State departments must establish consistent policy while allowing institutions to respond to their own populations and operational conditions. Wardens must maintain authority while delegating responsibility across multiple divisions. Security personnel and specialized staff must work within different professional structures while contributing to the same institutional mission. Seen from this perspective, prison organization is not simply a hierarchy. It is the administrative framework that allows a state to translate correctional policy into the daily operation of individual institutions.
| Organizational level | Typical responsibility |
|---|---|
| Governor / state government | Establishes the broader legal, executive, and budgetary environment for state corrections. |
| Secretary, commissioner, or director | Leads the statewide correctional agency and establishes department-wide priorities and policy. |
| Deputy director / assistant secretary / regional administrator | Oversees prison operations, a geographic region, groups of institutions, or major statewide functions. |
| Warden or superintendent | Has overall responsibility for the operation, security, administration, and performance of an individual prison. |
| Deputy / chief deputy / associate warden | Directs major institutional divisions and coordinates operations on behalf of the warden. |
| Captains / majors / program or division managers | Manage major security, housing, program, business, or operational functions. |
| Lieutenants | Provide shift, area, unit, or specialized operational supervision. |
| Sergeants | Provide first-line supervision of correctional officers and daily security operations. |
| Correctional officers and specialized line staff | Carry out direct supervision, security, movement, searches, counts, communication, and other daily institutional responsibilities. |
The Federal Prison System
Federal imprisonment developed later than state imprisonment in the United States. For much of the nineteenth century, the federal government had no large, independent prison system. Federal criminal law was more limited than it is today, and people convicted of federal offenses were often confined in state prisons and local jails under arrangements with the federal government. That approach became increasingly difficult as the number of federal prosecutions grew and concerns developed about overcrowding, inconsistent conditions, and the lack of federal control over people serving federal sentences.
The major turning point came in 1891, when Congress passed the Three Prisons Act. The legislation authorized the first three federal penitentiaries: United States Penitentiary Leavenworth in Kansas, United States Penitentiary Atlanta in Georgia, and the federal penitentiary at McNeil Island in Washington. The act established the foundation of a distinct federal prison system, but it did not immediately create the centralized bureaucracy that exists today.
During the early decades, the federal prisons operated with considerable independence. Wardens exercised substantial local authority, institutions had separate appropriations, and oversight from Washington was limited. This arrangement created an important administrative problem. The federal government had prisons, but it did not yet have a fully integrated prison system with consistent policies, professional standards, classification practices, and centralized planning.
By the 1920s, the weaknesses of decentralized federal prison administration were becoming more difficult to ignore. New federal laws, including Prohibition-era enforcement, increased the number of people entering federal custody. The system also began developing specialized institutions. A federal reformatory for women opened at Alderson, West Virginia, and a reformatory for younger men opened at Chillicothe, Ohio. These developments reflected a growing belief that prisons should not treat every incarcerated person or every institution in exactly the same way.
Assistant Attorney General Mabel Walker Willebrandt played an important role in pressing for centralized administration and standardized regulations. In 1928, James V. Bennett of the Bureau of Efficiency studied the federal prison system and identified problems that included overcrowding and insufficient programming. The combination of population pressure, administrative inconsistency, and changing correctional ideas strengthened the case for a national agency responsible for federal prisons.
Congress established the Federal Bureau of Prisons within the U.S. Department of Justice on May 14, 1930. The new agency was charged with the management and regulation of federal penal and correctional institutions. Sanford Bates became the first BOP director. Centralization changed the character of federal corrections by creating a single administrative structure capable of developing systemwide policies, professionalizing staff, coordinating construction, and standardizing institutional practices.
The BOP inherited 11 federal prisons. By the end of 1930 it operated 14 facilities holding just over 13,000 people. USP Lewisburg opened in 1932 as the first penitentiary constructed under the new Bureau. A federal medical center opened at Springfield, Missouri, in 1933. In 1934, Alcatraz opened as a maximum-security institution intended for people considered especially disruptive, violent, or escape-prone.
One of the most important changes in the early federal system was the movement away from treating prisons as interchangeable institutions. By 1940, the BOP operated 24 facilities and held 24,360 people. During this period, classification and differentiated security levels became increasingly important. Rather than placing people with very different custody requirements in the same type of institution, the Bureau developed a range of facilities and housing arrangements designed for different security and program needs.
This development helped establish a principle that remains central to correctional administration: prison placement is a management decision as well as a sentencing consequence. A court imposes a sentence of imprisonment, but correctional administrators must decide where that sentence will be served and what degree of security, supervision, programming, and institutional control is appropriate.
Federal Prison Industries, Inc. was created by Congress in 1934 and began operating under the trade name UNICOR. It is a wholly owned government corporation associated with the Bureau of Prisons. Its correctional purpose has historically centered on providing work, training, and structured activity for incarcerated people.
Work has long served several purposes in prison administration. It can reduce institutional idleness, provide a predictable daily routine, support prison operations, and offer opportunities to develop employment skills. Historically, incarcerated workers performed institutional jobs such as food service, maintenance, clerical work, carpentry, and groundskeeping in addition to work in prison industries. The federal system's emphasis on work illustrates how correctional programs can simultaneously serve institutional-management and rehabilitative goals.
Centralized administration also allowed the BOP to develop more consistent educational, vocational, and treatment programs. The historical material collected for this chapter emphasizes that federal administrators viewed productive activity as both a method of maintaining institutional order and a way to prepare people for eventual return to the community.
Professionalization was equally important. The creation of the BOP reduced the autonomy of individual wardens and moved federal prisons toward common policies and standards. The Bureau sought to improve staff training, reduce political patronage, develop classification systems, and coordinate operations across institutions. In organizational terms, the federal system was becoming a bureaucracy rather than a collection of largely independent prisons.
For roughly four decades after 1940, the federal prison population remained comparatively stable. The source material reports a population of 24,252 in 1980, close to the 24,360 held in 1940. The number of institutions nevertheless increased as the BOP moved toward facilities designed for more clearly defined security and population groups.
The 1980s marked a dramatic break from that pattern. Federal law-enforcement priorities and sentencing policy changed substantially. The Sentencing Reform Act of 1984 established determinate federal sentencing, eliminated federal parole for offenses committed after its effective date, and altered the role of good-time credit. Congress also enacted mandatory minimum sentencing provisions during the late 1980s and early 1990s. From 1980 to 1989, the federal prison population more than doubled, increasing from just over 24,000 to almost 58,000, while the number of federal prisons rose to 62.
Growth continued during the 1990s. Increased federal prosecution of drug and immigration offenses contributed to rising admissions and longer periods of confinement. By the end of 1999, the federal prison population had reached approximately 136,000 and the BOP was operating 95 institutions. Over the following years, the population continued upward, eventually exceeding 217,000 people in 119 institutions.
In 2014, the BOP population declined for the first time in more than three decades. Later legislative and policy changes continued to affect federal sentencing and incarceration. The First Step Act of 2018 became particularly significant. Among other changes, it affected good-conduct time, recidivism-reduction programming, earned time credits, reentry opportunities, and portions of federal sentencing law.
Current BOP data provide a useful contrast with the peak-growth era. In October 2026, the Bureau reported 152,656 total federal inmates, including 137,069 people in BOP custody and 15,587 in other types of facilities. The Bureau's historical overview reports that it operates 120 federal prisons. These figures should be understood as a current snapshot rather than a fixed characteristic of the system; federal prison populations change with admissions, releases, sentencing policy, court decisions, and administrative practices.
The central responsibility of the Bureau of Prisons is to carry out federal sentences of imprisonment while maintaining institutions that are appropriately secure and providing programs intended to support successful reentry. This mission combines several correctional purposes. The Bureau must maintain custody and public safety, operate institutions safely, manage a geographically dispersed population, provide basic services, classify people according to risk and need, and prepare eligible individuals for return to the community.
This combination helps explain why the federal prison system is more than a collection of facilities. It is a national administrative system. Individual prisons differ in security level and mission, but they operate within a centralized agency that establishes policy, assigns people to institutions, manages transfers, coordinates specialized services, and oversees institutional performance.
Classification is one of the most important administrative functions described in the historical federal material. Once a person is committed to federal custody, the BOP must determine an appropriate institution. Historically, designation decisions considered factors such as offense seriousness, detainers, expected sentence length, prior commitments, escape history, violence, medical or program needs, institutional security, available bed space, and proximity to home.
The underlying principle remains important even as particular classification policies change: the sentence determines that a person will be incarcerated, while correctional classification determines the institutional environment in which that sentence will be served. Classification therefore connects court information with correctional management.
The 1997 Federal Probation article included in the source collection places particular emphasis on the presentence report, or PSR. Prepared through the federal probation process, the PSR provides verified information about the offense, criminal history, education, employment, family circumstances, substance-use history, medical concerns, and other factors that can influence correctional decisions.
Historically, BOP administrators relied heavily on this information when making designation, programming, and release-planning decisions. The relationship illustrates an important feature of federal corrections: correctional administration does not begin only when a person reaches the prison gate. Information developed during the court and sentencing process becomes part of institutional classification and case management.
The federal correctional process involves several agencies with different responsibilities. The BOP is principally responsible for people serving federal sentences, while the U.S. Marshals Service has an important role in the custody and movement of people awaiting federal court proceedings. The courts impose sentences, federal probation personnel develop information used during sentencing and supervision, and the BOP administers imprisonment and correctional programming.
The 1997 article provides a valuable historical picture of how closely these components interacted. It describes cooperation in pretrial detention, institutional designation, case management, programming, community placement, and release planning. Some of the particular facilities, programs, statistics, and terminology described in that article belong to the federal system of the 1990s and should not be read as a description of current operations. Its larger organizational lesson, however, remains useful: federal corrections operates through relationships among courts, correctional administrators, detention authorities, and community-supervision systems.
The federal system has also used community-based placements as part of the transition from incarceration to release. Historically these facilities were called halfway houses, Pre-Release Guidance Centers, Community Treatment Centers, and later Community Corrections Centers. Today, residential reentry centers and other forms of prerelease custody continue the broader idea that transition from prison to community can be managed in stages.
The historical development of these programs demonstrates a shift in correctional thinking. Release is not simply the moment when confinement ends. It is an administrative process involving housing, employment, treatment, supervision, family adjustment, and public-safety planning. The First Step Act expanded the importance of recidivism-reduction programming and opportunities for eligible individuals to earn time credits toward prerelease custody.
The National Institute of Corrections was created by statute in 1974. Although associated with the federal correctional landscape, NIC serves a broader purpose than operating federal prisons. It provides information, training, technical assistance, and professional-development resources to federal, state, and local correctional agencies.
Its creation reflects the increasing professionalization of corrections during the twentieth century. Prison administration requires specialized knowledge about leadership, classification, security, staffing, facility management, training, and correctional policy. NIC was designed to help correctional agencies develop and share that professional knowledge across jurisdictional boundaries.
The sources collected for this reading span very different periods. The 1997 article by John W. Roberts is valuable because it explains how the BOP understood its mission, classification system, relationships with the courts, and community-corrections role at that time. However, its references to the number of institutions, population totals, Community Corrections Centers, Intensive Confinement Centers, and Comprehensive Sanctions Centers describe the federal system of the 1990s.
For that reason, historical sources should be used to understand institutional development rather than treated as current operational manuals. Contemporary BOP information is used here when describing present population and agency status. The distinction itself is instructive: correctional systems change as sentencing laws, populations, organizational priorities, technology, and correctional philosophies change.
The federal prison system developed from a small group of largely autonomous institutions into a centralized national correctional agency. The Three Prisons Act of 1891 established the foundation, but the creation of the Federal Bureau of Prisons in 1930 transformed federal corrections by bringing institutions under consistent administrative control. Classification, professional staff development, prison industries, education, specialized facilities, and coordinated case management became defining elements of the emerging system.
The system changed dramatically again after 1980 as sentencing laws and federal enforcement priorities produced unprecedented population growth. Later reforms, including the First Step Act, contributed to another period of change. Understanding this history is essential because the contemporary BOP cannot be understood simply by looking at today's institutions. Its organization, security levels, classification practices, programs, and reentry functions developed in response to more than a century of changing federal criminal law and correctional policy.
Private Prisons in the United States
Private for-profit prisons incarcerated 90,873 American residents in 2022, representing 8% of the total state and federal prison population. Since 2000, the number of people housed in private prisons has increased 5%.
Harmful crime policies of the 1980s and beyond fueled a rapid expansion in the nation’s prison population. The resulting burden on the public sector led to the modern emergence of for-profit prisons in many states and the federal system. Of the 1.2 million people in federal and state prisons, 8%, or 90,873 people, were in private prisons as of year end 2022.¹
States show significant variation in the use of private prisons. At one end of the spectrum, Montana incarcerates almost half of its prison population in privately run facilities, but in another 23 states, private prisons are not used at all. A total of 27 states and the federal government use private corporations like GEO Group, CoreCivic,² LaSalle Corrections, and Management and Training Corporation to run some of their corrections facilities.
Montana is not alone in its heavy reliance on private prisons. Alaska, Arizona, Hawaii, New Mexico, and Tennessee rely considerably on private prisons for housing sentenced people. In these states, between 20% and 39% of the prison population resides in a for-profit prison (see Table 1).
The proportion of imprisoned people in private facilities compared to public facilities has not changed considerably in the past 20 years. In 2000, 8% of the imprisoned population was also in private facilities; but fluctuations in the total number of people imprisoned over 20 years have translated to a 5% rise in the number of people serving their sentence in private prisons. Since 2012, however, the population in private prisons has decreased significantly.
Notes: * = Growth began at zero. ** = Wisconsin does not have anyone housed at private facilities. However, when a person is housed out of state under the Interstate Corrections Compact or the Intergovernmental Agreement, Wisconsin does not track if the facility is a private facility or state or federally owned facility. *** = The Federal count includes Washington, DC residents convicted of a felony. As of December 31, 2001, DC residents convicted of a felony are the responsibility of the Federal Bureau of Prisons.
Source: Carson, E. A., & Kluckow, R. (2023). Prisoners in 2022 – Statistical Tables. Bureau of Justice Statistics. See Table 4 and Table 14.
Historically, the largest prison system relying on privatization is the federal Bureau of Prisons (BOP). Since 2000, the BOP’s reliance on private facilities has decreased by 11%. The number of people in federal custody in its private facilities totaled 13,834 people in 2022.³ This decrease can be attributed to President Joseph Biden’s executive order to phase out the BOP’s use of private prison beds. A substantial number of people remain incarcerated, though, in these for-profit prisons.
Under the jurisdiction of the U.S. Department of Homeland Security, there is an average of 28,289 people held daily in immigrant detention, and it is estimated 79% of this population is held in privately run facilities.⁴
Political influences have been instrumental in securing the growth of for-profit private prisons. Because the prison population grew in 2022 for the first time in almost a decade, the privatization debate will likely intensify as opportunities for the prison industry may increase as corporations seek to make profits in related corrections areas.
1. The counts presented in this fact sheet are primarily obtained from the Bureau of Justice Statistics’ Prisoners in 2022 – Statistical Tables report, with the exception of Connecticut, which provided its own figures.
2. Formerly Corrections Corporation of America.
3. Federal private facilities include prisons, halfway houses, and systems of home confinement.
4. ACLU. (2021). More of the same: Private prison corporations and immigration detention under the Biden Administration; U.S. Immigration and Customs Enforcement. (2023). FY 2023 detention statistics – ICE average daily population EOFY2023. https://www.ice.gov/doclib/detention/FY21-detentionstats.xlsx
This fact sheet was updated by Research Analyst Kristen M. Budd, Ph.D.
The Sentencing Project promotes effective and humane responses to crime that minimize imprisonment and criminalization of youth and adults by promoting racial, ethnic, economic, and gender justice.
Updated February 2024
A Historical Case Study: Private Prisons and Immigration Policy
One way to understand the political economy of privatization is to examine a historical case in which prison companies, lawmakers, lobbying organizations, and immigration policy intersected. In 2010, NPR investigated the development of Arizona Senate Bill 1070 and reported relationships among private-prison interests, lawmakers, lobbying activity, and the American Legislative Exchange Council process. The reporting is retained here as a historical case study rather than evidence of current policy.
Its continuing value is that private correctional companies were already identifying immigration detention as a potential growth market. That observation becomes more meaningful when read beside the contemporary financial material later in this chapter.
The Financial Structure Behind Incarceration
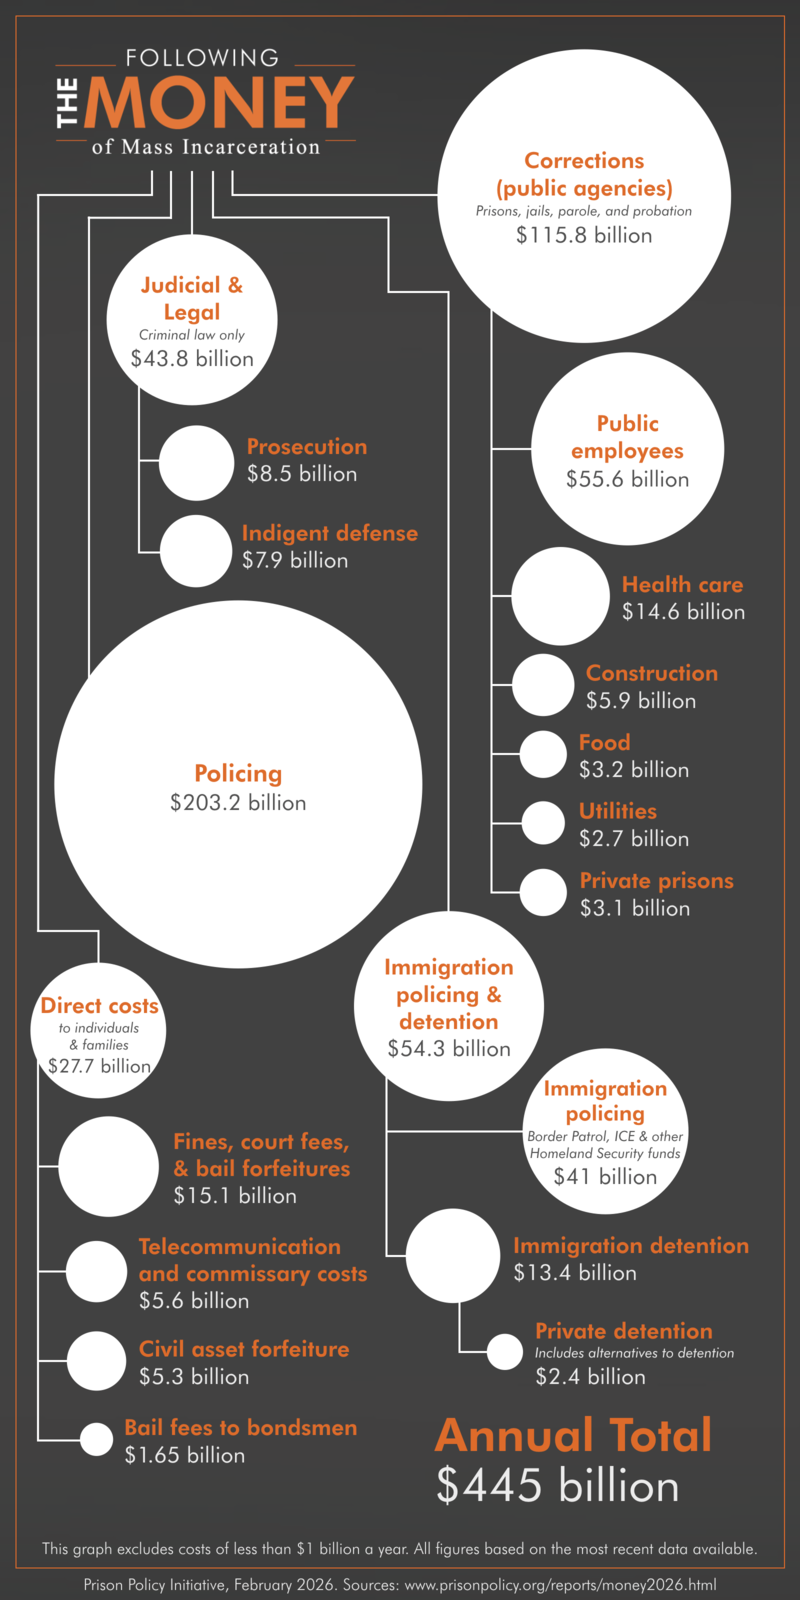
The report’s central infographic compares major annual costs across the criminal legal system. Policing is the largest category at about $203.2 billion. Public corrections agencies, including prisons, jails, probation, and parole, account for about $115.8 billion. Judicial and legal costs associated with criminal law are estimated at $43.8 billion. Immigration policing and detention account for another $54.3 billion. Direct costs paid by individuals and families are estimated at $27.7 billion.
Figure 1. Prison Policy Initiative overview of major annual costs associated with mass incarceration and criminalization. Circle size represents relative spending.
One of the report’s most important findings is that public spending did not simply fall as correctional populations declined. Between 2017 and 2025, corrections spending increased in nominal dollars even while the combined correctional population fell by more than one million people. When 2017 spending is adjusted for inflation, the picture becomes more complicated: corrections spending is slightly lower in real terms, while policing and especially immigration policing and detention increased.
Figure 2. Inflation-adjusted comparison of selected government criminal legal system spending, 2017 and 2025.
The authors connect persistent correctional costs to staffing, overtime, salaries, facility maintenance, health care, and other expenses that do not necessarily decline at the same rate as incarcerated populations. Immigration policing and detention changed most dramatically. The report estimates that this category grew from $20 billion in unadjusted 2017 spending to $54.3 billion in 2025.
The report compares 2017 spending with 2025 spending in both nominal and inflation-adjusted dollars. The table below is important because it prevents a misleading comparison. A dollar spent in 2017 did not have the same purchasing power as a dollar spent in 2025.
Table 1. Estimated government spending on mass incarceration and criminalization. The adjusted 2017 column expresses 2017 spending in approximately 2025 dollars.
The $417.1 billion government-spending total in this table is not the same as the report’s $445 billion overall estimate. The larger figure also includes direct costs paid by individuals and families. The report’s authors also stress that their estimates are not a complete accounting of every social and economic cost. Some categories rely on older data that have been adjusted for inflation, and some costs cannot be measured reliably at the national level.
This distinction is useful when evaluating correctional policy. Large national totals can show scale, but they should not be treated as if every dollar is measured with equal precision. Corrections in the United States are fragmented across federal, state, county, and municipal governments, and spending decisions vary substantially among jurisdictions.
| Area | 2017 unadjusted | 2017 adjusted | 2025 |
|---|---|---|---|
| Policing | $144.9B | $190.4B | $203.2B |
| Corrections | $90.9B | $119.5B | $115.8B |
| Immigration policing & detention | $20.0B | $26.3B | $54.3B |
| Judicial & legal | $33.1B | $43.5B | $43.8B |
| Total | $288.9B | $379.8B | $417.1B |
What Correctional Systems Spend Money On
The Prison Policy Initiative estimates that federal, state, and local governments spend approximately $115.8 billion annually on corrections. This category includes prisons, jails, juvenile facilities, probation, and parole. The report emphasizes that corrections remains overwhelmingly a public enterprise. Private companies participate in the system, but governments still finance and administer most correctional activity.
Personnel is the largest correctional expense identified in the report. State and local governments employed approximately 648,020 full-time-equivalent corrections employees in March 2024. When state, local, and selected federal correctional payroll costs are combined, the report estimates about $55.6 billion in annual public correctional employee costs. The estimate does not capture every pension or contractor expense, meaning the full personnel cost may be higher.
Staffing costs also help explain why correctional budgets do not move in perfect proportion to incarcerated populations. A prison or jail cannot simply eliminate officers, medical staff, transportation functions, food service, or building operations every time its population decreases. Minimum staffing requirements, overtime, recruitment problems, aging facilities, and employee compensation can keep costs high even when fewer people are confined.
The report estimates approximately $15.3 billion in correctional health-care costs across public and private facilities, with about $14.6 billion attributed to government-run systems. This estimate is based partly on older state prison data adjusted for inflation, so the authors treat it cautiously. Jail health costs may be particularly difficult to estimate because millions of people cycle through jail booking each year and must be screened for urgent medical and behavioral-health needs.
Correctional facilities are expensive to build, renovate, and maintain. The report estimates about $5.9 billion in annual correctional construction and capital costs. It also warns that available census data may undercount local jail construction. Since 2002, more than 1,300 counties have reportedly allocated tens of billions of dollars for jail construction, illustrating how local decisions can create long-term financial obligations.
Construction is often financed through bonds. This means the cost of a new prison or jail can extend far beyond the original construction price because governments may pay interest for many years. Facility design also affects later operating expenses. Large institutions require heating, cooling, water, electricity, maintenance, security technology, and continuous staffing regardless of whether every bed is occupied.
The report estimates about $3.2 billion annually for food in publicly operated correctional facilities and about $2.7 billion for utilities. Both estimates rely on older federal expenditure data adjusted for inflation, so they should be viewed as approximations. Even so, they illustrate an important correctional reality: prisons and large jails function much like small cities. They must provide meals, water, sanitation, heating, cooling, lighting, and other basic services every day of the year.
These expenses help explain why reducing incarceration does not automatically produce immediate budget savings. A facility that moves from 1,000 incarcerated people to 850 still requires perimeter security, control rooms, housing-unit coverage, medical services, food preparation, utilities, maintenance, transportation, and administration. Significant savings may require closing housing units or entire facilities rather than simply reducing the population.
Government budgets do not capture the full financial burden of incarceration. The report estimates that people involved in the criminal legal system and their families directly pay at least $27.7 billion each year through fines and fees, bail-related costs, civil asset forfeiture, telecommunications, and commissary spending.
State and local governments collected approximately $15.1 billion in fines, fees, and bail forfeitures in 2023. Commercial bail adds another layer of cost because defendants and families may pay a nonrefundable premium to a bail bond company. The report uses an estimate of roughly $1.65 billion in annual bail-bond fees, while noting uncertainty in industry data.
Families also provide money for phone calls, video communication, tablets, electronic messages, and commissary accounts. Drawing on a 2025 FWD.us report, the authors estimate approximately $5.55 billion in annual family spending on these categories. In many facilities, commissary accounts are used not only for snacks but also for hygiene items, clothing, shoes, and other necessities.
This spending matters to corrections because incarcerated people usually have little or no independent income. Costs imposed inside institutions are therefore frequently transferred to families outside them. The report argues that correctional contracts can also create incentives when vendors return a portion of their revenue to the government agency that awarded the contract.
The report deliberately excludes several additional family costs from its $27.7 billion estimate because they are not paid directly into the criminal legal system. These include travel for visitation, care for children, packages, reentry expenses, and income lost because of incarceration. The distinction reminds students that a government budget measures only part of the economic impact of confinement.
Immigration Detention and the Changing Correctional Marketplace
The most dramatic spending change identified in the report involves immigration policing and detention. The authors estimate $54.3 billion in annualized 2025 spending for immigration policing and detention, compared with $20 billion in 2017 before adjusting for inflation. The figure includes regular federal appropriations as well as additional multi-year funding that the report converts into annual averages.
Immigration detention is especially important for understanding the contemporary private correctional industry. ICE is the primary federal agency responsible for immigration detention. The report estimates immigration detention costs at about $13.4 billion annually when regular appropriations and annualized additional funding are combined. It further estimates that about $2.4 billion in 2025 revenue went to private companies operating immigration detention or related services.
Private correctional involvement is not limited to secure detention facilities. The report notes that federal funding for Alternatives to Detention includes electronic monitoring and that a subsidiary of The GEO Group, B.I. Incorporated, has been a major contractor in this area. This illustrates how correctional privatization can extend beyond prison walls into surveillance, monitoring, transportation, treatment, and reentry-related services.
For students, the key point is that the private prison debate has changed. Traditional state and federal private prisons remain part of the industry, but immigration detention has become a major source of private correctional revenue. A company can therefore experience growth even when the number of people held in privately operated state prisons is stable or declining.
The report makes an important conceptual distinction: private prison companies do not independently arrest, prosecute, sentence, or incarcerate people. They operate under contracts with government agencies. For that reason, the authors place private prisons inside the larger public corrections and immigration-detention systems rather than treating them as a separate criminal justice system.
In 2025, the report estimates that private prison and detention companies received almost $5.5 billion in revenue. About $3.1 billion came from the criminal legal system and about $2.4 billion from ICE detention. The industry remains dominated by The GEO Group and CoreCivic, but Management & Training Corporation, LaSalle Corrections, Akima Global Services, and Immigration Centers of America also hold substantial contracts.
A recurring source of confusion in debates over private prisons is the difference between revenue and profit. Revenue is the total amount a company receives. It must cover salaries, food, buildings, transportation, debt, taxes, and other operating expenses. Profit, or net income, is what remains after those expenses. The report notes that the two largest companies reported billions of dollars in revenue while their reported net income was far smaller.
This distinction does not settle the ethical debate over incarceration for profit. It does, however, make the debate more precise. A $2 billion contract or revenue figure should not be described as $2 billion in corporate profit. Students evaluating privatization should ask how contracts are structured, what services are included, what performance standards apply, how governments monitor compliance, and what incentives the payment system creates.
The report’s company-level estimates show how strongly contemporary private corrections is connected to both traditional criminal custody and immigration detention. The two largest companies receive substantial revenue from both sources, while some smaller companies in the report are almost entirely tied to ICE detention.
Table 2. Prison Policy Initiative estimates of 2025 private prison and detention company revenue by source. Totals may reflect rounding.
The authors caution that these are estimates assembled from company reports, federal data, PREA audits, contract information, and other sources. Information is more complete for publicly traded companies such as GEO Group and CoreCivic than for privately held firms. New detention contracts can also appear faster than reliable national financial data can be assembled.
The table complicates the traditional image of the private prison industry. GEO Group and CoreCivic together account for most of the estimated revenue, but ICE is now a major customer. For GEO Group, the report estimates slightly more 2025 revenue from ICE than from the criminal legal system. CoreCivic remains more heavily weighted toward criminal legal system contracts, but ICE still represents a substantial share of its business.
The most important lesson from Following the Money of Mass Incarceration 2026 is that corrections operates within a network of financial relationships. Governments pay employees, operate institutions, contract with private companies, finance construction, purchase medical care, and maintain facilities. At the same time, incarcerated people and their families pay fines, fees, bail premiums, communication costs, commissary expenses, and other costs associated with confinement.
The report also challenges the idea that private prisons are the primary financial beneficiary of mass incarceration. Public agencies and public payrolls are much larger than the private prison industry. That does not eliminate concerns about private incarceration. Instead, it places privatization in context and shifts attention toward the contracts, incentives, accountability mechanisms, and policy decisions that connect private companies to public correctional authority.
Finally, the growth of immigration detention demonstrates how the correctional marketplace can change. Private correctional companies are no longer understood only through contracts to operate state prisons. Their business can include immigration detention, federal detention, electronic monitoring, transportation, treatment, and other correctional services. The modern privatization debate therefore requires students to look beyond the prison itself and examine the wider network of public and private institutions involved in confinement and supervision.
| Firm | Estimated ICE revenue | Estimated criminal legal system revenue | Total |
|---|---|---|---|
| The GEO Group | $1.211B | $1.186B | $2.398B |
| CoreCivic | $742M | $1.446B | $2.188B |
| Management & Training Corp. | $120M | $272M | $392M |
| LaSalle Corrections | $213M | $174M | $387M |
| Akima Global Services | $105M | $0 | $105M |
| Immigration Centers of America | $24M | $0 | $24M |
| Total | $2.415B | $3.078B | $5.493B |
Conclusion
The American prison system is not a single institution. It is a collection of state systems, a federal system, privately operated facilities working under public contracts, and a large network of supporting agencies and vendors. Its modern form developed through changing correctional philosophies, sentencing laws, administrative reforms, security practices, and political choices.
Understanding prisons therefore requires more than knowing what happens inside a cellblock. Students must understand why prisons grew, how incarcerated people are classified, how authority moves through a correctional organization, how state and federal systems differ, and how public and private money shapes institutional choices. Prison policy creates organizational consequences: sentencing law changes population size, population size changes staffing and facility needs, and contracting decisions can shift who provides a service without eliminating government responsibility for people in custody.
Chapter Review Questions
- Explain how the Pennsylvania and Auburn models influenced the development of American prisons. Which features of these early systems remain visible in modern correctional practice?
- Describe how prison classification and security levels affect daily institutional operations. Why is classification more than simply deciding whether a prison is minimum, medium, or maximum security?
- Compare the organizational structure of a typical state prison system with the Federal Bureau of Prisons. What functions are similar, and what features are distinctive to the federal system?
- Evaluate the contemporary private-prison debate using the evidence in this chapter. How do state use of private prisons, immigration detention, government contracting, and the distinction between revenue and profit complicate the debate?
- The federal prison population grew dramatically after the 1980s and later declined. Explain how sentencing law and correctional policy can create downstream effects on prison populations, staffing, facilities, programming, and spending.
References
Bosworth, M. (Ed.). (n.d.). Three Prisons Act 1891. In Encyclopedia of Prisons & Correctional Facilities.
Federal Bureau of Prisons. (2026). Historical information.
Federal Bureau of Prisons. (2026). Population statistics.
Federal Bureau of Prisons. (2026). Timeline.
Federal Bureau of Prisons. (n.d.). First Step Act.
Kang-Brown, J., & Wagner, P. (2026, February 11). Following the money of mass incarceration 2026. Prison Policy Initiative.
Roberts, J. W. (1997). The Federal Bureau of Prisons: Its mission, its history, and its partnership with probation and pretrial services. Federal Probation.
Sullivan, L. (2010, October 28). Prison economics help drive Ariz. immigration law. NPR.
The Sentencing Project. (2024). Private prisons in the United States.
Michigan Department of Corrections. (2026). Department organization and responsibility.
Washington State Department of Corrections. (2026). Organization.

